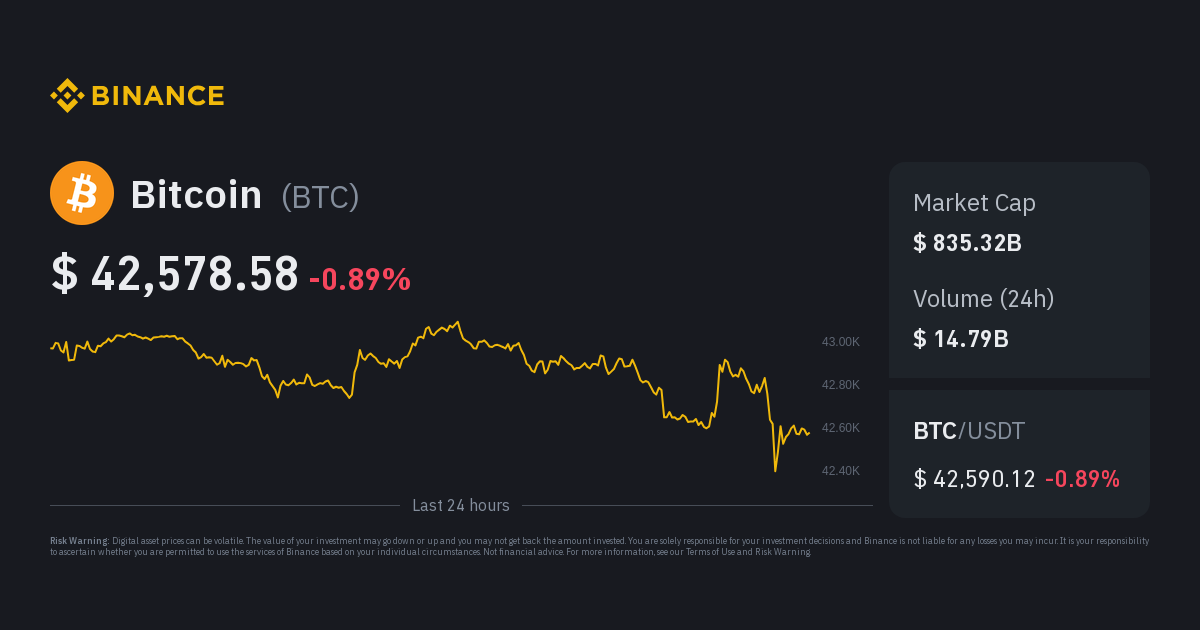
Bitcoin remains locked in a crucial price range between $43,500 and $41,400, oscillating within this corridor for several days. This Bitcoin price action signifies a period of consolidation as bulls and bears wrestle for control. Let’s dissect the current situation through a daily chart lens.
Bitcoin Price Update Observation:
- Price: The current range suggests some indecisiveness within the market. Bulls attempted a push towards $45,000 but faced resistance, while bears couldn’t sustain a dip below $41,000.
- Dominance: At 52.54%, Bitcoin’s market dominance indicates continued influence over altcoins. However, a significant rise could signal weakness in altcoins, and vice versa.
- Liquidations: $61 million in liquidations across long and short positions suggest heightened volatility and possible uncertainty among traders.
- Long/Short Ratio: The $44.70 million longs to $16.51 million shorts hint at a slight bullish bias among traders. However, the gap is narrowing, indicating weakening conviction.
Technical analysis
- Moving averages: The 50-day and 200-day moving averages (MAs) currently converge around $43,000. A break above both MAs could signal bullish momentum, while a drop below could indicate a bearish trend.
- Relative Strength Index (RSI): Currently at 51, the RSI suggests the market is neither overbought nor oversold, leaving room for movement in either direction.
Possible scenarios
- Breakout: A decisive break above $45,000 could trigger a rally towards $50,000 and potentially higher. Conversely, a break below $41,000 could lead to a decline towards $38,000.
- Continued consolidation: The market could remain range-bound for some time, awaiting a major catalyst to break the indecisiveness.
Important factors to consider
- Global economic news: Economic developments and regulatory decisions might impact risk appetite, influencing Bitcoin price.
- On-chain analysis: Metrics like active addresses and exchange inflows/outflows can provide insights into investor sentiment and potential buying/selling pressure.
- Altcoin performance: Strong performance from altcoins could attract capital away from Bitcoin, potentially dampening its price.
Conclusion
Analyzing the Bitcoin price update through a daily chart reveals a period of consolidation with conflicting forces at play. While technical indicators offer some guidance, fundamental factors, and broader market sentiment will ultimately determine the next directional move. Staying informed and exercising caution while navigating this uncertain phase is crucial.
Disclaimer: This analysis is for informational purposes only and should not be considered investment advice. Please conduct your research before making any investment decisions.
Referral
You can SignUp Binance and get 100USDT CashBack
SignUp Kucoin and Get 20% OFF on every Trade
SignUp OKX and Get a Mystery Box worth 50USDT


I'm Moussa Obscur, a tech enthusiast based in the UK and germany with over 7 years of experience as a tech reviewer at XiaomiToday. I've had the privilege to collaborate with renowned tech brands worldwide, helping readers make informed choices in the fast-paced world of technology. Let's connect and explore the latest trends in the tech field! Official Email: moussaobscur15@gmail.com


